Total crash analysis
Two types of tasks are currently supported in Crash_severity_model:
Total historical crashes: using traditional analytical and visualization approaches to show historical crashes.
Policy model: the model allows a policy maker to make assumptions on the road condition (e.g., speed limit, slope etc.) and the model would simulate the risk changes compared to the exisiting policy.
In this section, Total historical crashes is focused.
Usage
Many total historical crashes (minor, severe and fatal) related analysis (and figures) can be produced using:
crash_total --workdir <WORKING DIRECTORY>
            [--regions <REGIONS>]
            [--crash_severity <CRASH SEVERITY TYPES>]
            [--vehicle_types <VEHICLE TYPES>]
            [--years <CRASH YEARS>]
where --workdir must be specified for storing all the intermediate files and the system outputs.
Optionally, the following arguments can be defined:
--regions: It is used to specify the regions to be used [default: all regions in NZ]. It can be chosen fromAuckland,Bay of Plenty,Canterbury,Gisborne,Hawke's Bay,Manawatu-Whanganui,Marlborough,Nelson,Northland Region,Otago Region,Southland,Taranaki,Tasman,Waikato,Wellington,West Coast.--crash_severity: Crash severity to be analyzed [default: all crashes types]. It can be chosen fromNon-Injury Crash,Minor Crash,Serious CrashandFatal Crash.--vehicle_types: Vehicle types to be analyzed [default: all vehicle types]. It can be chosen frombicycle,bus,schoolBus,carStationWagon,moped,motorcycle,suv,taxi,truck,vanOrUtility,vehicle.--years: Years to be analysed [default: all years]. It should be set in a list, e.g.,--years 2017,2018.
A few examples are shown below:
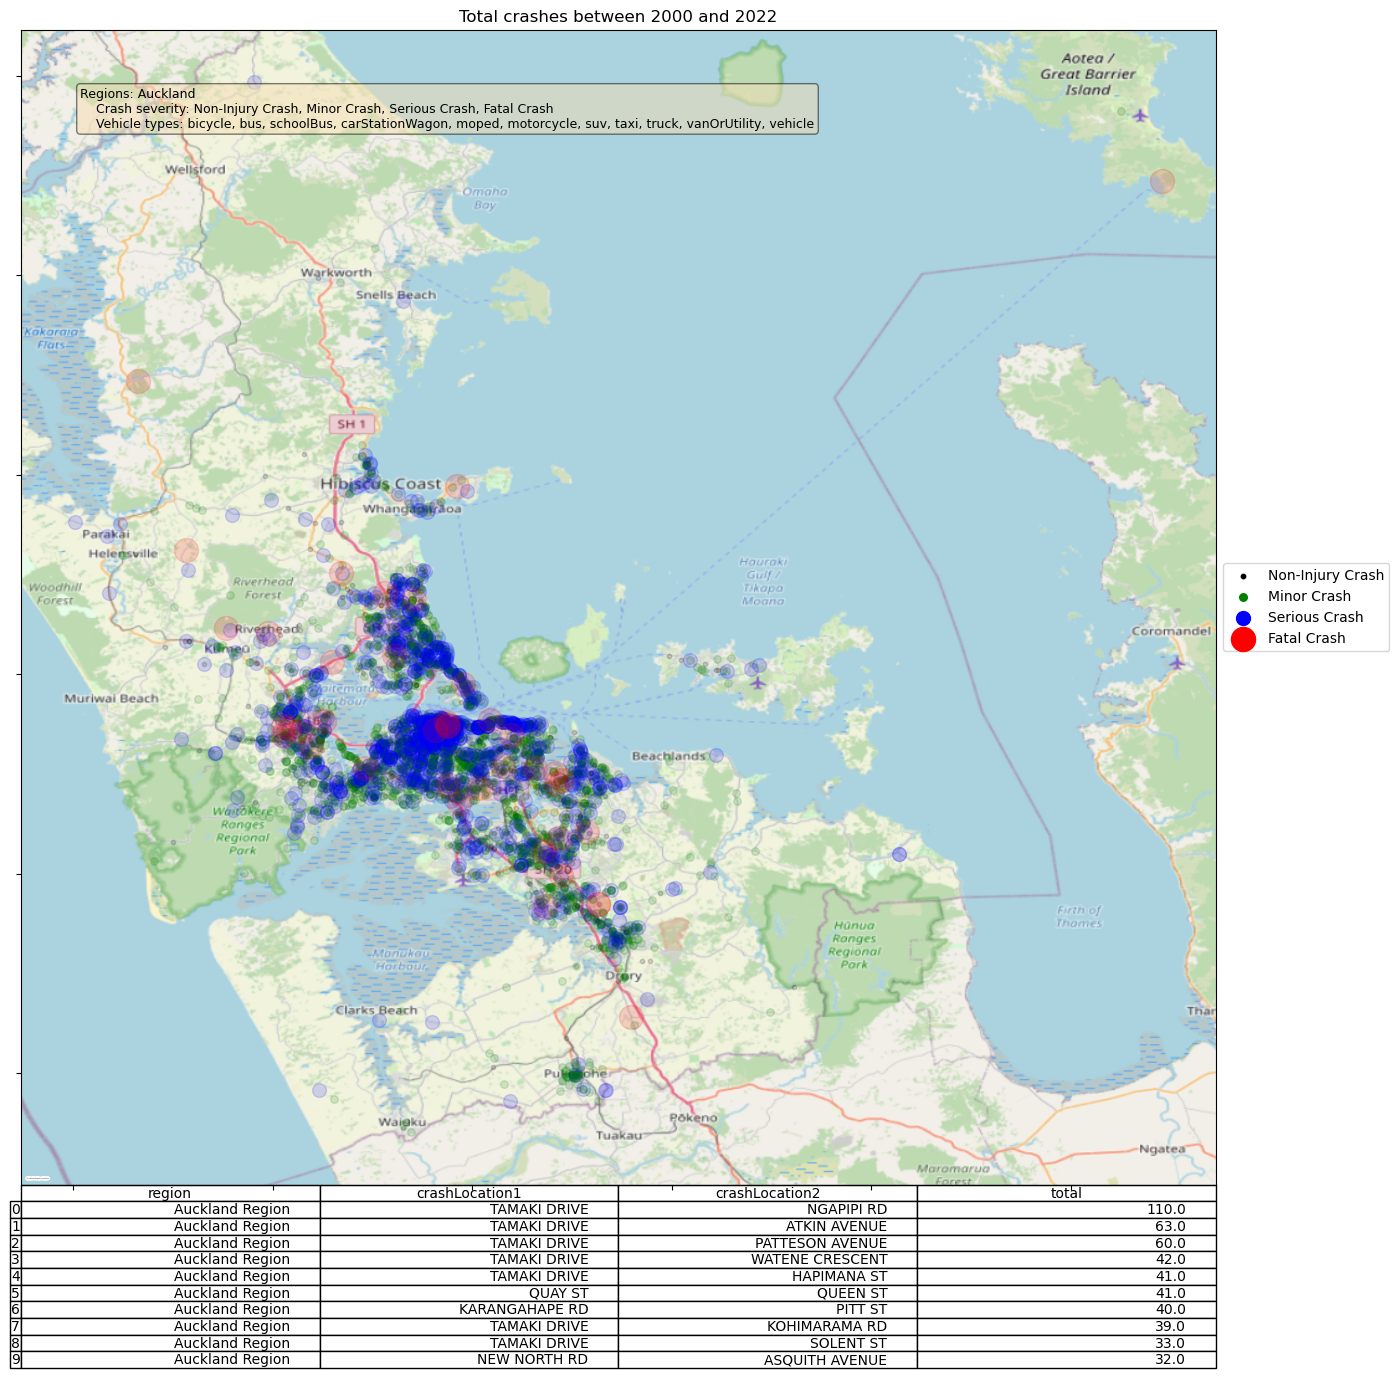
Example 1: All crashes in Auckland between 2000 and 2022
crash_total --workdir /tmp
            --regions Auckland
The following figure shows all crash types (and all vehicle types) happened in Auckland between 2000 and 2022. The top 10 roads with the most crashes are also listed.
Example 2: Fatal and severe bicycle crashes in Auckland between 2010 and 2020
crash_total --workdir /tmp
            --regions Auckland
            --crash_severity 'Serious Crash', 'Fatal Crash'
The following figure shows serious and fatal crashes (for bicyles) happened in Auckland between 2000 and 2022.

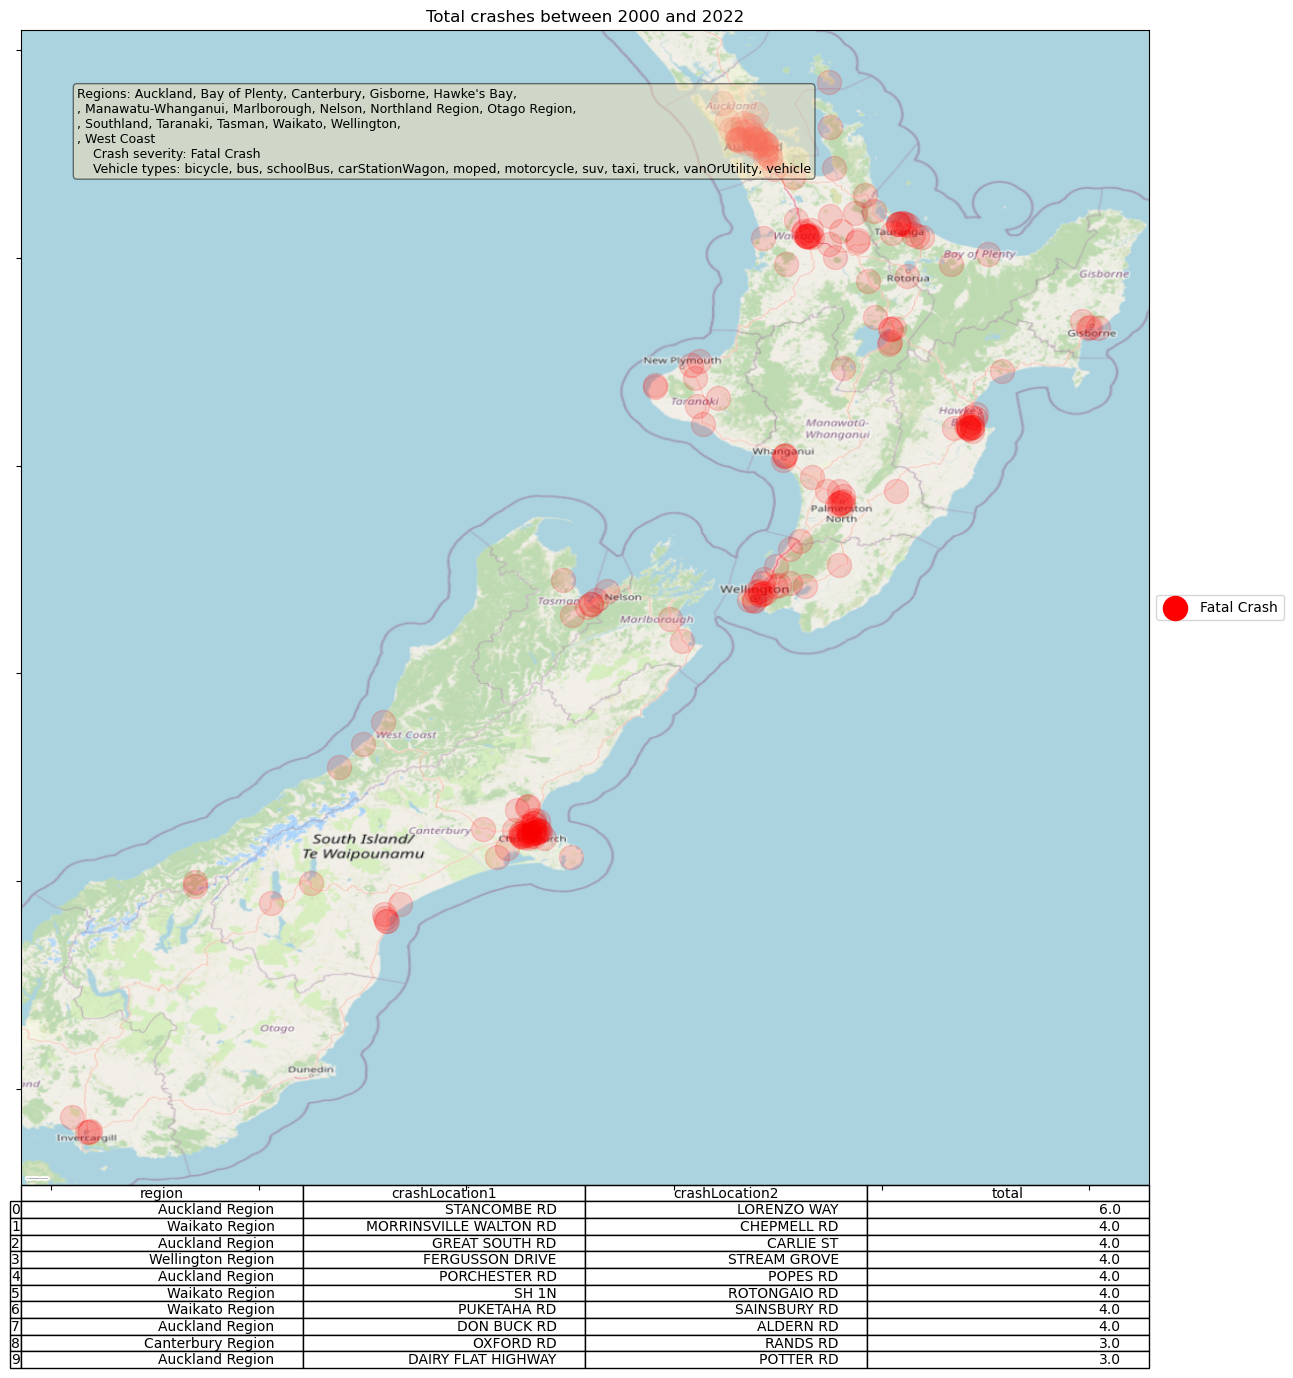
Example 3: Fatal crashes in New Zealand between 2000 and 2020
crash_total --workdir /tmp
            --crash_severity 'Fatal Crash'
The following figure shows all fatal crashes (for bicyles) happened in New Zealand between 2000 and 2022.
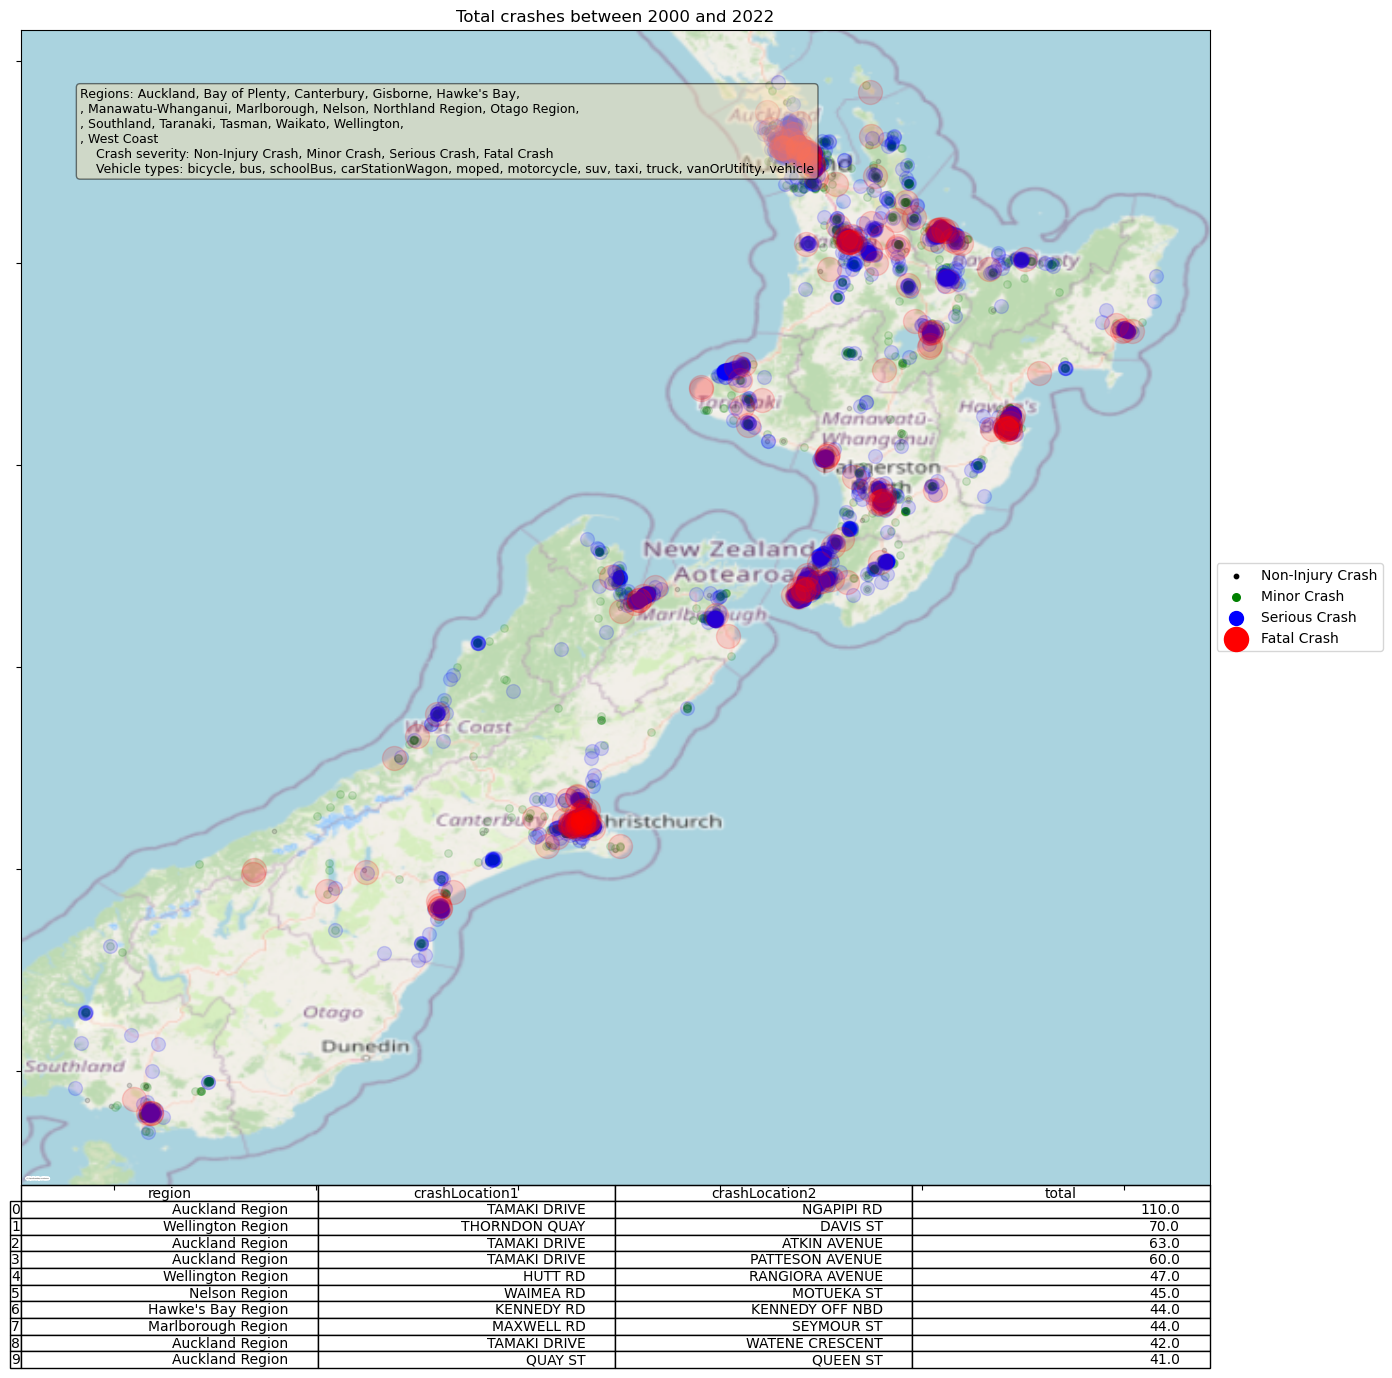
Example 4: All crashes in New Zealand between 2000 and 2020
The following figure shows all crashes (for all vehicle types) happened in New Zealand between 2000 and 2022.